By DeliaD’Agostinoa DannyParkerb PacoMeliàc GiovanniDotellid
- a European Commission, Joint Research Centre (JRC), Ispra, VA, Italy
- b Florida Solar Energy Center, University of Central Florida, Cocoa, FL, USA
- c Politecnico di Milano, Dipartimento di Elettronica, Informazione e Bioingegneria, Milan, Italy
- d Politecnico di Milano, Department of Chemistry, Materials and Chemical Engineering, Milan, Italy
Abstract
Refurbishing existing buildings to reduce energy use is a priority worldwide to reduce greenhouse gas emissions. Millions of buildings around the globe have old roofs that are poorly insulated, but with large roof surface areas that could potentially provide significant renewable energy generation. Often, photovoltaic panels are simply added onto existing buildings regardless of thermal integrity. However, due to weathering, roofs frequently need repairs over their useful life. We evaluate a comprehensive methodology using EnergyPlus and TRNSYS simulation tools to evaluate how best to combine solar electric generation and improved insulation to achieve cost reductions, improve efficiency and renewable energy utilization at the time roofs are accessed. Advantages of combining efforts into a single intervention has not been fully explored in building energy research. We further incorporate important impacts that PV stand-off arrays have on roof thermal performance from shading and long-wave irradiance to skies. These influences have important comfort implications for poorly insulated structures with increasing summer heat waves associated with climate-related warming. They also have strong interaction with installed roof insulation levels. With an example analysis in Milan, Italy, we considered three typical residential building types in wide-use around the world (single-family, multi-family, apartment complex) with different geometries, insulation levels and roof constructions. We evaluated two options: re-roofing (roof in need of repair/replacement) and refurbishment (energy intervention for roof improvement). We optimized roof insulation levels via state-of-the-art building energy simulations considering both energy and documented costs. PV electric generation was quantified in detail, also exploring how PV array roof shading affects roof thermal performance, an influence not previously considered. This is particularly important for uninsulated buildings where upper floors can experience excessive summertime heating. Both heating and cooling needs are considered to determine the optimal roof intervention and what savings- and related costs- can be obtained depending on differing parameters. We found combining appropriate insulation with PV can provide a cost-effective option to reduce net primary energy use in residential buildings. Savings from insulation alone varied from 3% (apartment complex) to 17% (single-family). When adding PV systems with the roof initially uninsulated, net savings range from 55% (apartment complex) to 80% (single-family). Shading from stand-off PV arrays reduced summer cooling loads by 17% in uninsulated apartment complexes and provided large predicted improvements in comfort to upper floor dwellings next to exposed roofs.
Graphical abstract
Simulated top floor apartment air temperatures adjacent to roof on summer peak day with and without roof shading from PV arrays and insulation (Unins/Ins) in Milan. Delia D’Agostino, Danny Parker, Paco Melià, Giovanni Dotelli, Optimizing photovoltaic electric generation and roof insulation in existing residential buildings, Energy and Buildings, submitted.
Keywords
1. Introduction
Interest in reducing energy consumption in buildings is recognised worldwide as a priority [1]. Buildings account for about 40% of global energy consumption, and 36% of associated CO2 emissions [2]. At the same time, the need to electrify energy demand to facilitate greenhouse gas emission reductions, and reduce climate change warming potentials, makes it important to locate new available areas for renewable energy production. Building rooftop solar photovoltaic (PV) arrays coupled with electrical storage are a demonstrated means for addressing building energy use since roof areas are often unobstructed to solar radiation and freely available for such utilization [3], [4]. World building floor area and associated roof expanses are enormous (223×109m2 globally) and expected to approximately double by 2050 [5].
With PV production, designing new buildings at nearly or net zero energy consumption has proved feasible around the world [6], [7], [8], [9], but application concerns persist in particular for existing buildings [10], [11].
Considering the age, inefficiency, and slow pace of renovation of the building stock [12], existing buildings have major potential to achieve energy savings [13]. Retrofit is a key factor to achieve the European (EU) 2030 Energy and Climate targets [14] (55% greenhouse gas emission reduction, 33% improved energy efficiency, 32% renewables increase) in the view of being the first climate-neutral continent by 2050 [15]. Improvements to the building stock are indispensable, as stated in the ‘Renovation wave’ initiative [16].
Envelope retrofit is among the most frequent interventions in buildings [17], [18], [19]. In particular, roof retrofit is one of the first options selected in building design optimization [20], [21]. Although many studies focus on optimization of insulation for walls, slab on the ground floor, and windows [22], [23], fewer studies examine roof optimization [24], [25], [26].
Roofs in existing residential buildings are often old, composed of diverse materials, and poorly insulated, increasing needs for heating and cooling. Many are in need of intervention for weather protection [27]. Given these considerations, roof retrofit becomes a priority compared to other measures. In many countries, insufficient roof insulation can lead to considerable overheating of top floor apartments during summer [28]. This issue may become crucial under foreseen climate change scenarios of temperature increase [29].
Integrating both roof insulation and PV production simultaneously has advantages [30]. A more synergistic method to approach building retrofit is still missing and many interventions are implemented without a comprehensive knowledge of the potential savings and costs [31]. Installing PV without making thermal improvement of roofs may be counterproductive. For instance, in old buildings, improving insulation might be more cost-effective than installing PV, while in more recent constructions PV installation might be preferable [32], [33]. As PV generation will expand in the future [34], it is crucial to make sure that the roof is suitable for PV installation. Intervention of insulation and installed PV at the time which roofs need weather-related repairs is another compelling opportunity for existing buildings since access is almost always expensive.
Settling for an insulation level that is too low leaves elevated energy consumption, often over the life of a building, whereas insulating too extensively may be too capital intensive relative to other means to cut energy use. Therefore, it is important to examine in which cases – how and at which level – roof insulation is justifiable at the time of PV installation or roofing improvement.
2. Research aims and questions
This study addresses the potential of implementing roof insulation retrofits in existing buildings at the same time PV systems are added. We propose an innovative approach to roof retrofit, which includes different aspects (e.g. thermal, electrical storage, cost factors, physical influences), in different building types, to derive best methods of implementation and provide guidance towards an informed decision.
We implement a detailed step-wise methodology with an example analysis done for Milan, Italy. Firstly, several parameters (e.g. envelope insulation, including various materials and thicknesses, with/without PV, with/without energy storage) are defined. Secondly, starting conditions (e.g. no/low insulation, arbitrary roof improvement/roof in need of refurbishment) are defined. Finally, the optimal intervention with savings and related costs, are obtained in each situation. Shading from raised stand-off PV arrays is examined and how this influences heat gains and insulation performance.
To cover the large variety of building archetypes and generalize application of results, we considered three common prototypes: single-family building, two-story multi-family building and five-story apartment complex. We examined roof insulation and PV installation (with and without electricity storage) to identify the most cost-effective roof configurations, considering electrical and thermal impacts. We aim to answer the following research questions:
- • What is the optimal insulation level in roof refurbishment in existing residential buildings?
- • How would improving roof insulation reduce heating and cooling loads?
- • How much electricity can be generated through combined PV installation?
- • How will stand-off PV arrays, with and without insulation, reduce solar absorptance and cooling needs while improving comfort in roof-adjacent dwellings?
We used the well-accepted EnergyPlus and TRNSYS simulation tools, implemented within BEopt, driven by hourly weather data [35], [36], [37], [38]. We determined that 120 building energy simulations would be needed to address the above questions for building types for a single location. Accordingly, this paper focuses on the continental climate, which represent a considerable part of the climate variability at EU and global level. Specifically, we selected Milan (Italy) as typical of the temperate (Cfb type) temperature climate in the Köppen climate classification [39], with a pronounced seasonality, no real dry season, and warm summers. This climate type is similar to many other population centres around the world, such as Paris (France), Melbourne (Australia), London (UK), Vancouver (Canada), Berlin (Germany), and Port Elizabeth (South Africa). The developed methodology can also be applied to other locations and climates around the world. Further, changing the weather files in the simulation tool can allow future anthropogenic warming to be taken into account [40].
3. Building retrofit, PV production, and energy storage
We briefly summarize why it is logical to consider refurbishment ot the building stock considering both roof insulation and solar PV installation simultaneously. We also outline the low level of progress towards such refurbishment. Few data are available on numbers, existing depth or trends in building renovation rates [41]. In 2011, the renovation rate of the building stock was assessed between 0.5% and 2.5% per year [42]. An average 1% EU renovation rate was estimated, in line with a study where rates of 1.2%, 0.9% and 0.5% refurbishment per year were assessed in different countries [43]. Innovative technology development is boosting the retrofit market to target NZEB status [44].
Envelope retrofit (roofs, walls and floors) is one of the most implemented interventions together with the installation of HVAC (heating, ventilation, air conditioning) systems, and replacement of windows [45]. This is appropriate since addressing the building envelope is key to controlling thermal losses between indoors and outdoors [46].
Society-wide there is need for increased renewable electricity production to address the rise in electricity demand. The growing number of new appliances, IT devices, telecommunication systems, and air conditioning installed in European buildings resulted in a 74% average increase of electricity consumption over the last decade [47], [48], [49]. According to Eurostat data, electricity consumption for domestic use per capita was 1109 kWh in 2011 and 1225 kWh in 2012 in Milan, Italy [50]. This may grow further with foreseen increasing electrification of building heating and water heating.
Taking advantage of PV systems to reduce energy loads is of growing importance to both cover building energy needs (e.g. equipment and appliances), and contribute delivery to the grid. Since 2005, PV power capacity in the EU has increased from 1.9 GW to 117.5 GW at the end of 2018 [51]. Already in 2014, the 2020 National Renewable Energy Action Plan target of 83.7 GW was exceeded, reaching about 88.4 GW [52]. At the end of 2018, PV systems installed in the EU could generate around 130 TWh of electricity or about 4.8% of the final electricity demand. The decrease in price and increase in efficiency is shown in Fig. 1 [53].
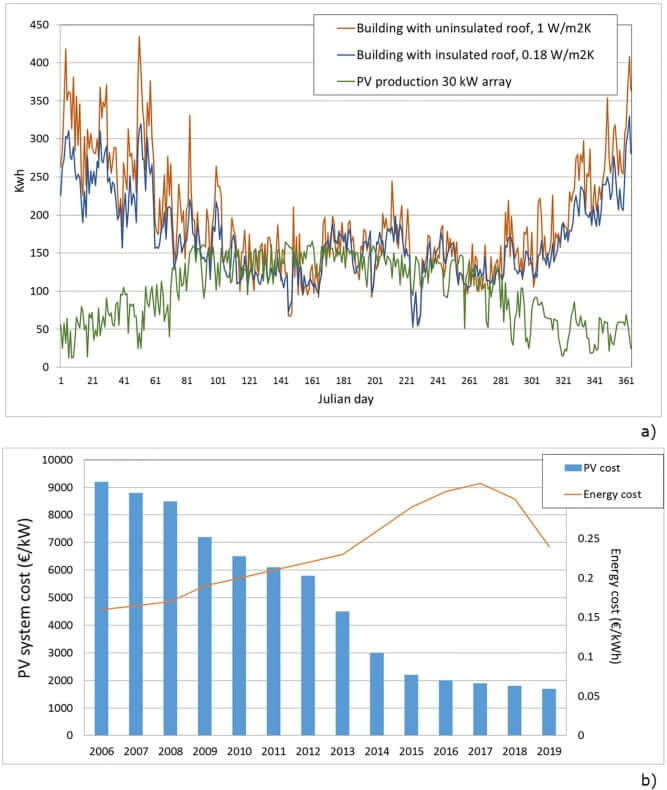
Fig. 1. a) Match between daily PV production and building’s loads over a year for a multi-family building located in Milan [EnergyPlus simulation by the authors]; b) Trends of PV and energy costs [54], [55].
Local energy storage is becoming increasingly useful to satisfy energy demand on a 24-hour basis [53], [54], [55], [56] and for increasing building self-consumption. In residential buildings, the achievable self-sufficiency and the power exchanged with the grid change considerably when PV is combined with batteries. In this case, the surplus energy can be stored and used when needed, decreasing the dependency on the grid. Moreover, the decrease of PV installation price (Fig. 1), tariffs for PV power, and falling battery prices favour technology spread [34]. Another advantage is to overcome the issue of the time-shift between PV production and the building’s energy needs (Fig. 1). Fig. 1a illustrates why combining insulation with PV is important since generally winter energy loads are greatest when PV output is lowest. Insulation can save most during these times.
The importance of energy storage is also highlighted by funding. Incentives of about 4.4 million € were provided in Northern Italy in 2019 and 2020 for storage systems coupled with residential and commercial PV [57]. The scheme funded half the cost of buying and installing storage systems for a generation capacity up to 20 kW.
PV panels are becoming common worldwide and more often integrated as a building material [27] (Fig. 2a). However, a remaining advantage of stand-off PV arrays, with an air space below the panels, comes from roof shading and modification to roof surface long-wave radiation to the sky, that affect thermal transmittance and, consequently, cooling and heating loads. For instance, a 39% reduction in cooling during summer was obtained both in simulations and measurements [58]. Peng et al [59] determined PV shading could exert important influences on heat conduction through covered roof assemblies. Empirical evidence on impacts to end-use cooling is also compelling: Tsurusaki et al. [60] observed an average 26% reduction in monitored space cooling after rooftop PV panels were installed atop Japanese buildings.
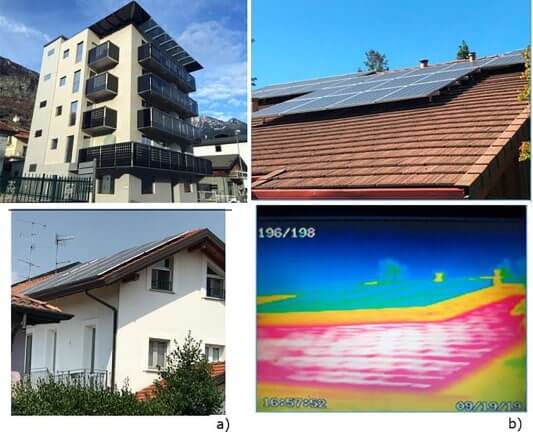
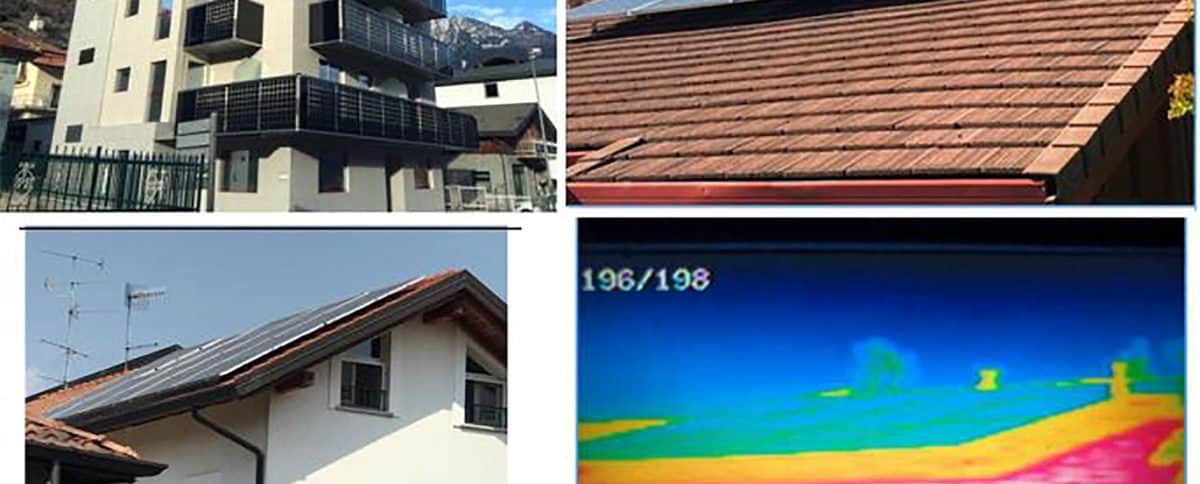
Fig. 2. a) Examples of rooftop PV systems in existing buildings in Northern Italy (Images acquired by D. D’Agostino); b) Visible and IR image illustrating impact of shading from photovoltaics on thermal heat gain to brown tile roof. Colour is proportional to temperature, with white and red hottest, and black and blue coolest (Comparative image and thermograph by D. Parker). (For interpretation of the references to colour in this figure legend, the reader is referred to the web version of this article).
Thermal impacts of PV stand-off array on roof heat transfer performance underneath are complex depending on array shadow, spacing, tilt, wind as well as roof view factor to the sky. Arrays strongly influence thermal long-wave radiation exchange for both cooling and heating. The specific challenges of modelling this influence are given in [59], [61], [62], [63] and were addressed in the simulations. In this case the solar shading influence of stand-off array is important.
However changes to roof long-wave irradiance to the day and night skies are also vital for capturing effects as the altered roof view factor to the sky, and to a lesser extent the change roof surface convective heat transfer. Dominguez et al. [61] saw a 38% reduction in roof heat gain during the cooling season in San Diego, California and Miller et al [63] observed a large decrease in roof-related space cooling in Phoenix, Arizona in measurement and simulation. Kapsalis and Karamanis [62] measured and simulated a 17.6% decrease to space cooling in Western Greece. Decreased solar irradiance is important in winter, potentially increasing heating through lost roof solar absorption, but altered long-wave re-radiance provides a compensating effect for heating since winter solar irradiance is lower and nights are longer with colder effective sky emittances.
In our simulation analysis, both influences were addressed although impacts are very small save for uninsulated or poorly insulated roof assemblies. This is accomplished within the EnergyPlus simulation by assuming that the PV array covered portion of the roof has a 90% interruption of incident solar radiation compared to the exposed sections. However, the long-wave emittance of this covered section is also altered from 0.92 for fully exposed sections vs. 0.10 for the covered segments. If the array vertical spacing from the roof is close, there can also be an insulating effect from the air below the stand-off array. However, this can vary considerably depending on array spacing and wind conditions. Close spacing may also lead to secondary heating of the roof below from the elevated temperature of the PV arrays above. Consequently, as a conservatism, we made no adjustments. We note that the fraction of the roof covered by PV can have significant impact and this varied depending on the prototypes.
Our simulation results were similar to those of Dominguez et al. [61]. We found that heating impacts to insulated assemblies are near adiabatic with effectively no influence; the largest influence was found in uninsulated roofs. From simulations, we anticipate some geographic differences in PV panel-roof interaction since high wintertime solar gains may create modest increases to heating from PV panel shadowing as shown by Kapsalis and Karamanis [62]. The authors acknowledge that the impact of rooftop PV panels during heating season depend on various factors including the type of roofs and climates as noted in the literature [1], [2], [3]. Thus, the simulated cases should be considered illustrative for the prototype characteristics chosen. However, making allowance for variations due to climate and roof constructions, our simulation results are in line with both previously cited empirical studies.
Fig. 2b provides an empirical evidence of the phenomenon from thermography. The shading impact of a South-facing stand-off PV array is evident: the roof surface is hotter outside the PV array shadow and much lower underneath. However, within our evaluation, we account for this influence for the first time. This is done by adjusting both the roof shading and long-wave emittance of the covered roof segment.
4. Methodology
The developed methodology aimed at optimizing roof insulation and determining the cost-effectiveness of installing PV (with and without electrical storage) in different building prototypes, as well as determining whether it is cost-effective to refurbish a roof before installing a PV system. The retrofit potential of roof insulation and PV was evaluated by building energy simulations. A total of 120 simulations (40 per building type) were carried out for three baseline building prototypes (single-family, multi-family, apartment complex). Prototypes were configured starting from a topology of common residential prototypes developed within the Tabula project [64].
Starting from the baseline buildings, interventions considered adding insulation, PV, and PV with storage to optimize the roof arrangement (Fig. 3). The best configuration, resulting in the optimal roof insulation level and PV system size was derived for each building following the cost-optimal methodology described in [65], [66]. The optimal level can be identified from a technical and economic perspective in the lower part of the curve depicting minimized global costs (€/m2) and energy consumption (kWh/m2y) [67], as given in Fig. 3. A sensitivity analysis was finally carried out on several factors: energy price associated with varying carbon pricing, differing economic time horizons, different insulation materials and re-roofing costs.
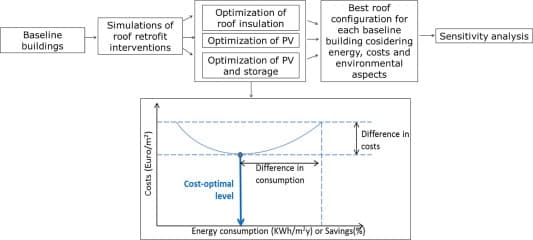
Fig. 3. The research methodology.
We evaluated two primary scenarios:
a) Refurbishment;
b) Re-roofing.
In scenario a), we looked for the optimal insulation level at the natural time when the building already needed intervention. This is typically due to aging and roof weather proofing concerns. In this case, the cost for improving insulation is only associated with the insulation material and its application labour. We further considered two sub − conditions in this case:
1) Buildings with no existing insulation;
2) Buildings with a low insulation level (as commonly built after 1980).
We identified the optimal level of insulation with and without PV under two different circumstances:
3) Grid-connected PV systems;
4) PV systems with electrical storage.
Scenario b) involves the energy-related intervention improvement of the roof to increase insulation, meaning that the roof otherwise does not need to be altered. This tends to be more expensive. Also in this case, we considered sub-scenarios 3) and 4) with differing PV systems- grid-connected or grid connected with electrical storage.
The impact of shading of a stand-off PV array was considered in all cases.
The building prototypes are described in Section 4.1. Section 4.2 describes the roof characterization in terms of stratigraphy, insulation materials and physical properties. Energy simulations are outlined in Section 4.3.
4.1. Baseline building prototypes
Based on the Tabula classification [64], we created three prototypes representing a statistical aggregate of building types whose geometry and physical characteristics capture the intrinsic variation of specific building typologies (Table 1). Each prototype has a different occupancy level according to the census data [68]. Although this topology is drawn from Italy, we point out that similar types are in wide use around the world with the analysis relevant elsewhere.
Table 1. Summary and thermal characteristics of the existing residential building prototypes.
| Building type | Single-family | Multi-family | Apartment complex |
|---|---|---|---|
| Example |
 |
 |
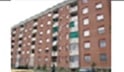 |
| Model rendering |
 |
 |
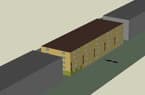 |
| Area (m2) | 120 | 956 | 4056 |
| Units | 1 | 9 | 50 |
| Story number | 2 | 3 | 5 |
| Occupant per dwelling | 2.5 | 18 | 100 |
| South-facing roof area (m2) | 84 | 188 | 811 |
| Available PV area (m2) | 70 | 141 | 650 |
| Pitch (°) | 23 | 27 | 5 |
| Modules (number) | 18 | 88 | 400 |
| PV power capacity DC (kW) | 6.0 | 30.0 | 138.0 |
| Envelope | |||
| Windows | 23 m2 with double clear glass (2.2 W/m2K) | 81 m2 with double clear glass (2.2 W/m2K) | 120 m2 with double clear glass (2.2 W/m2K); 24 m2 corner apartments |
| Walls | Low insulation (0.8 W/m2K) | ||
| Ceiling | Uninsulated (2 W/m2K) | ||
| Doors | Uninsulated (2.86 W/m2K) | ||
| Air leakage | 4 ACH at 50 Pa blower door pressure | ||
| System | |||
| Heating | Air source heat pump; COP = 3.5 | ||
| Cooling | COP 4.1 mini-split cooling system | ||
| Hot Water | Electric boiler providing 120 l per day at 55 °C (1 unit) | Electric boiler providing 76 l per day at 55 °C per unit (9 units) | Electric boiler providing 76 l per day at 55 °C per unit (50 units) |
| Mechanical ventilation | 20.3 l/s, continuous with 72% ERV (energy recovery ventilation) (1 unit) | 16.5 l/s per unit, continuous with 72% ERV (9 units) | 13.7 l/s per apartment, continuous with 72% ERV (50 units) |
We estimated the maximum PV system size for each building prototype (Table 1). The number of South-oriented modules that fit on the building’s roof was estimated by calculating the available South-facing roof area, assuming that each module has a 1.63 m2 footprint and that 75% of the gross roof area (some overhang) is available for PV installation in smaller (single-family, multi-family) roofs, while in larger roofs (apartment complex) the proportion is 80%. For the single-family and multi-family prototypes, we assume that only the south-facing fractions of the roof are eligible for PV so that the installed array size is more limited than with the flat roof of the apartment complex.1
We assumed that high-efficiency (21%) PV modules (exemplified by Sunpower X21-345 units) will become common in near future applications [69], [70]. When stand-off PV arrays are placed above the roof, they provide solar shading, and also block the surface-view factor and the far-infrared emittance linked to sky radiative heat transfer. Following the approach by Peng and Yang [28], we accounted for PV shading by modifying the total solar absorptance and the far-infrared emittance of the roof. We assumed that the roof under the PV arrays has no effective view factor with limited r solar exposure or long-wave heat transfer. The terra cotta roof tiles solar absorptance was set to 75%, with a 94% far-infrared emittance in single-family and multi-family prototypes. The apartment complex prototype was modelled as a concrete surface roof with an 80% absorptance and a 92% far-infrared emittance. The shading PV influence was captured in our evaluation with the influence of added thermal insulation investigating how these two factors interacted with pre-existing roof insulation.
In relation to systems, the single-family and multi-family prototypes have a cellar containing heating equipment. Similar buildings were used by Ecofys GmbH and the Danish Building Research Institute [70], as well as by [71], [72]. The multi-family prototype matches Tabula type 3 [64]. It consists of nine units with a total net living area of 956 m2. The apartment complex prototype represents a multi-story high-density urban occupancy dwelling. The structure, facing North and South, has five floors and a total of 50 apartments (81 m2 each) separated on either side by an access corridor.
All baseline prototypes have neighbouring buildings on either side (Table 1). The baseline efficiency level is considered to be standard for buildings constructed in the 1980s [64]. Accordingly, the walls are insulated to a low level (0.8 W/m2K), windows are double glazed (2.2 W/m2K) and the overall structure has an air tightness of 4 ACH at a 50 Pa test pressure. A minimum air exchange at maximum occupancy rate was considered in all buildings, consistent with occupation levels and ventilation rates proposed by Standard EN 15251 [73].
In future years, all-electric buildings in Europe will likely be advocated [74]. Thus, we assumed all-electric buildings with heat pumps (COP = 3.5 heating/ COP 4.1 for cooling) for both space heating and water heating so that the analysis could directly examine the balance of building electrical loads and solar electric generation.
4.2. Roof characterization
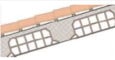
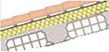
Typical roof types were identified from the Tabula research, further differentiated into six different insulation levels (Table 2).
Table 2. Roof typologies of the research.
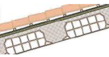
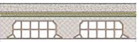
| Building type | Insulation level | Description | Thermal conductance (W/m2K) | Rendering |
|---|---|---|---|---|
| Single-family and multi-family | No | Pitched roof with brick-concrete slab. | 2.00 |
 |
| Low | 0.80 |
 |
||
| Medium | 0.60 |
 |
||
| High | 0.35 |
 |
||
| Very high | 0.20 |
 |
||
| Extra high | 0.15 |
 |
||
| Apartment complex | No | Flat roof with reinforced brick-concrete slab. | 2.00 |
 |
| Low | 0.80 |
 |
||
| Medium | 0.60 |
 |
||
| High | 0.35 |
 |
||
| Very high | 0.20 |
 |
||
| Extra high | 0.15 |
 |
The overall U-factor of heat transfer depends on the insulation of the roof and the ceiling below it. The roof/ceiling overall conductance varies considerably with U-values between 2.86 and 0.30 W/m2K depending on construction period and insulation. However, buildings older than 1976 had generally lower or no insulation with typical conductance of ∼2 W/m2K. In this study, we considered a ceiling with reinforced brick concrete slab with 1.65 W/m2K U-value as the most typical. Newer constructions can have even higher insulation levels with conductance between 0.34 and 0.15 W/m2K, depending on material and thickness [75].
The thermo-physical properties that govern efficiency-related performances of the considered roof retrofit materials are reported in Table 3 [28 and reference therein] that also shows the typical thicknesses available on the market, along with their typical costs.
Table 3. Thermal properties and market cost of roof insulating materials (RSI is the thermal resistance per unit area in SI units: m2K/W). [source for cost and performance data for generic insulation materials: 75].
| Insulation material | Thermal conductivity (W/m/K) | Specific heat (J/kg/K) | Density (kg/m3) | Empty Cell | Empty Cell | Empty Cell | Empty Cell | Empty Cell | Empty Cell | Empty Cell | Empty Cell | Empty Cell | Empty Cell | Empty Cell | Empty Cell | Empty Cell |
|---|---|---|---|---|---|---|---|---|---|---|---|---|---|---|---|---|
| Wood fiber panels | 0.038 | 2100 | 50 | Commercial thickness (mm) | 40 | 50 | 60 | 80 | 100 | 120 | 140 | 160 | 180 | 200 | 220 | 240 |
| Cost (€/m2) | 4.8 | 5.2 | 6.3 | 8.3 | 10.4 | 12.5 | 14.7 | 16.7 | 18.9 | 20.9 | 23.1 | 25.0 | ||||
| RSI (m2K/W) | 1.0 | 1.3 | 1.6 | 2.1 | 2.6 | 3.2 | 3.7 | 4.2 | 4.7 | 5.3 | 5.8 | 6.3 | ||||
| Cost per RSI (€/RSI) | 4.0 | 4.0 | 4.0 | 4.0 | 4.0 | 4.0 | 4.0 | 4.0 | 4.0 | 4.0 | 4.0 | 4.0 | ||||
| Cellulosic fiber | 0.039 | 2000 | 70 | Commercial thickness (mm) | 30 | 40 | 50 | 60 | 80 | 100 | 120 | 140 | 160 | |||
| Cost (€/m2) | 7.5 | 9.7 | 12.1 | 14.5 | 18.4 | 21.0 | 25.2 | 29.4 | 33.7 | |||||||
| RSI (m2K/W) | 0.8 | 1.0 | 1.3 | 1.5 | 2.0 | 2.6 | 3.1 | 3.6 | 4.1 | |||||||
| Cost per RSI (€/RSI) | 9.8 | 9.5 | 9.5 | 9.5 | 9.0 | 8.2 | 8.2 | 8.2 | 8.2 | |||||||
| High density fiberglass | 0.035 | 1030 | 32 | Commercial thickness (mm) | 40 | 50 | 60 | 85 | 100 | 150 | 200 | 235 | ||||
| Cost (€/m2) | 4.9 | 6.2 | 7.5 | 10.6 | 12.5 | 18.7 | 25.1 | 29.5 | ||||||||
| RSI (m2K/W) | 1.1 | 1.4 | 1.7 | 2.4 | 2.9 | 4.3 | 5.7 | 6.7 | ||||||||
| Cost per RSI (€/RSI) | 4.3 | 4.4 | 4.4 | 4.4 | 4.4 | 4.4 | 4.4 | 4.4 | ||||||||
| Rock wool | 0.037 | 1030 | 140 | Commercial thickness (mm) | 30 | 40 | 50 | 60 | 80 | 100 | ||||||
| Cost (€/m2) | 7.2 | 9.6 | 12.0 | 14.5 | 19.3 | 24.1 | ||||||||||
| RSI (m2K/W) | 0.8 | 1.1 | 1.3 | 1.6 | 2.2 | 2.7 | ||||||||||
| Cost per RSI (€/RSI) | 8.9 | 8.9 | 8.9 | 8.9 | 8.9 | 8.9 | ||||||||||
| EPS foam | 0.033 | 1350 | 24 | Commercial thickness (mm) | 20 | 40 | 50 | 60 | 80 | 100 | 120 | 140 | 160 | 180 | 200 | |
| Cost (€/m2) | 3.5 | 7.0 | 8.7 | 10.5 | 14.0 | 17.5 | 21.0 | 24.5 | 28.0 | 31.5 | 35.0 | |||||
| RSI (m2K/W) | 0.6 | 1.2 | 1.5 | 1.8 | 2.4 | 3.0 | 3.6 | 4.2 | 4.8 | 5.4 | 6.0 | |||||
| Cost per RSI (€/RSI) | 5.8 | 5.8 | 5.8 | 5.8 | 5.8 | 5.8 | 5.8 | 5.8 | 5.8 | 5.8 | 5.8 | |||||
| XPS foam | 0.032 | 1100 | 30 | Commercial thickness (mm) | 20 | 25 | 30 | 40 | 50 | 60 | 80 | 100 | 140 | 160 | 180 | 200 |
| Cost (€/m2) | 3.0 | 3.7 | 4.50 | 6.0 | 7.5 | 9.0 | 12.0 | 15.0 | 21.0 | 24.0 | 27.0 | 30.0 | ||||
| RSI (m2K/W) | 0.6 | 0.8 | 0.9 | 1.2 | 1.6 | 1.9 | 2.5 | 3.1 | 4.4 | 5.0 | 5.6 | 6.2 | ||||
| Cost per RSI (€/RSI) | 4.8 | 4.8 | 4.8 | 4.8 | 4.8 | 4.8 | 4.8 | 4.8 | 4.8 | 4.8 | 4.8 | 4.8 |
Fig. 4 identifies the most commonly used roof insulation materials.
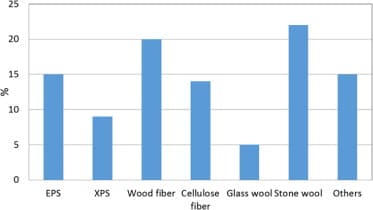
Fig. 4. Most common insulating materials in roofs (modified from [50]).
The advanced hourly simulation tool (described in Section 3.3) uses the properties of Table 3 to calculate the building thermal performance [76], [77]. The key parameter governing the roofing system heat transfer is the thermal resistance of the insulation, characterized by the material RSI value (m2K/W). The higher the RSI, the greater the resistance to heat transfer and the better the thermal performance of the roof insulation. Since the simulation not only considers the roof heat transfer of the insulation systems, but also the insulation cost, we also calculated the economic performance of each intervention measure in terms of cost per unit RSI. We consider two starting points for evaluating potential insulation improvements: no insulation (2.0 W/m2K) and a low insulation level (0.8 W/m2K). Each case was simulated with and without PV (with and without storage) at each insulation level (No, Low, Medium, High, Very high, Extra high).
4.3. Energy simulations
Energy simulations were performed dynamically using the detailed energy simulation, BEopt, developed by the U.S. National Renewable Energy Laboratory [35], [36]. The tool performs hourly energy simulations using the EnergyPlus engine developed by the Lawrence Berkeley National Laboratory and the U.S. Department of Energy [37]. The software is well recognized and used by the scientific community [77], [78], [79]. It estimates household loads related to heating, cooling, water heating and appliances. Simulation accuracy was validated by comparison with measured data which verified the feasibility of replicating energy uses in different climates as well as the validated success of the simulation at modelling performance changes from envelope insulation [80], [81]. Within the same software, renewable energy production from photovoltaic systems is predicted using the state-of-the-art transient simulation tool [42], [82].
The optimization process within BEopt searches for the most cost-effective option within a series of measures using a sequential search technique of all evaluated options, considering both roof insulation and PV generation levels [83]. All options are estimated against the cost of grid electricity while taking into account the cost of producing solar electricity using rooftop PV arrays [84]. Once the energy use of the baseline building is evaluated, the options are compared in a series of parametric evaluations whose equations are fully described in [71].
This research selected a study site located in Northern Italy, Milan, which has a continental climate characterized by middle latitudes having quite warm summers and cold winters [85]. This provides an ideal test case since this location is dominated by heating needs (2404 heating degree days), but also has significant cooling (380 cooling degree days). To provide appropriate climatic data, hourly Typical Meteorological Years (TMY) weather datasets were compiled for Milan for the most recent 15 year period [86]. Cost data were obtained from Table 1, Table 2, Table 3 for the specific insulation systems, PV and storage systems. Although climatic data are particular to Milan, results may be generalized to a number of similar climates around the world. Similarly, although cost data was rigorous and coming from a 2020 time frame, it was subjected to a cost uncertainty sensitivity analysis which is reported in results.
Setting up the simulations required a careful data collection related to the physical insulating materials properties (Table 2, Table 3), and the economic parameters as well as the anticipated carbon costs associated with electricity production (Table 4).
Table 4. Parameter set-up for the simulations.
| Parameter | Value |
|---|---|
| Emission rate CO2 per kWh | 489 g/kWh |
| Electricity price | 0.23 €/kWh |
| Module efficiency | 21% |
| Installation cost of PV system | 1750 €/kW |
| Cost for PV with storage system | 4750 €/kW |
| Cost for roof retrofit | 45 €/m2 |
| Ratio of battery storage to PV size | 4.00 kWh/kWpeak |
| Primary Energy Factor (PEF) | 2.0 |
| General Inflation rate (GR) | 2.0% |
| Energy Price Inflation rate (ER) | 3.0% |
| Discount Rate (DR) | 5.0% |
| Down Payment with Financing | 10.0% |
| Financing Interest Rate (FR) | 5.0% |
Economic parameter assumptions in Table 4 are taken from references [87], [71] to be consistent with recommended evaluation procedures of the European Commission. The overall PV systems costs (including modules, inverter, connections, fees, installation and profit) were found to be around 1750 €/kW for residential buildings in Northern Italy. Since the energy savings from insulation tend to better match utility peak generation requirements which happen in winter and during early morning hours, we created a case where the PV system includes on-site battery storage to better match the generation load profile. The required electrical storage for PV panels was assumed to be 4 kWh/kWpeak for all-electric buildings. This accords to values reported by [29] for high degree-of-self-sufficiency (DSS) buildings. From the same reference, we assumed that electrical storage costs approximately 750 €/kWh installed. This assumption, along with the storage requirement, resulted in a PV and storage installation cost of 4750 €/kW. To approximate their expected operational life, PV-battery storage systems were assumed to have a 15-year life, whereas the insulation system is considered to produce savings over the building life [34].
For the re-roofing cost, which includes removal, weather proofing and re-application, we assumed an average of 45 €/m2, although this cost can be highly variable. For instance, Baeli and Pelsmakers [84] found that the cost of re-roofing and insulating can range from 13 €/m2 to 126 €/m2 to attain Passive House insulation standards. Lohse et al. [85] found wide cost ranges (9–80 €/m2) for improving roofs in deep energy renovation projects in Austria and Germany [88], [89].
The current residential electricity price in Northern Italy is 0.23 €/kWh on average [90]. We assumed that conventional net metering remains in place for our analysis. For the carbon emissions rate for electricity, we used an emissions value of 489 g/kWh based on the Italian Greenhouse Gas Inventory report [91]. The other economic assumptions were similar to previous research as reported in [72].
A scenario tree to illustrate the simulation analysis is given in Fig. 5.
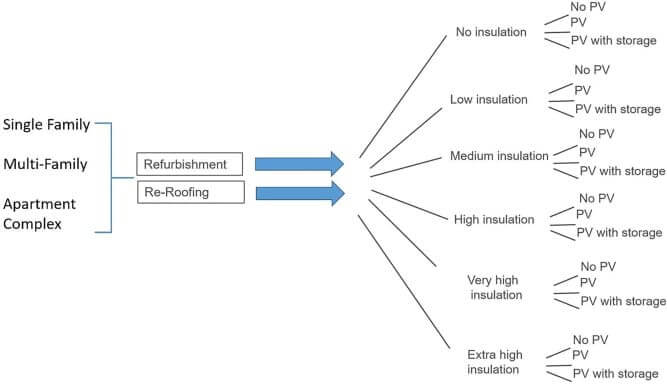
Fig. 5. Scenario tree of analysed cases for the evaluation.
We call attention to the fact that here we optimizing only the roof insulation of the building assembly. However, as shown in the authors’ previous work [71], [72], many other elements in buildings—walls, floors, windows and air tightness—are also important to consider within energy optimization. Here, however, we concentrate on the roof thermal assembly which has minimal thermal interactions with the other building elements. We do this because renovation for roof insulation or PV together can provide opportunities to improve that combined element of the building at lower cost and interruption to building occupancy.
5. Results and discussions
The optimization algorithm found the most cost-effective combination of insulation (material and thickness) and PV (with or without storage) for each building type. The best combination depends on many parameters, such as the initial insulation level of the roof and the different insulation costs. We show simulated on-site electricity for the results as well a primary energy as identified in the specific tabular and graphic results.
The following sections details results by building prototype (Section 5.1: Single-family prototype, Section 5.2 Multi-family prototype, Section 5.3 Apartment complex). Sensitivity analysis is given in Section 5.4. Full data will be available in a Data in Brief paper associated to this manuscript.
5.1. Single-family prototype
Wood fiber insulation panels were identified as the standard retrofit insulation, since it has the lowest cost per unit of thermal resistance (RSI) and is widely used commercially (Table 3). Moreover, beyond a comparable thermal performance between synthetic and wood fibre insulation 92], a lower carbon energy footprint was documented in wood fibre panels, in spite of a similar embodied energy [90]. We acknowledge that embodied energy and the environmental impact of materials is of increasing importance in buildings [92], [93], [94], [95].
Fig. 6a shows the predicted annual heating, cooling and total site electricity for the different insulation levels. The plot also shows the annual predicted kWh output of the 6 kW PV rooftop system. In Fig. 6b, the annual investment cost is shown in the two analysed scenarios (refurbishment and re-roofing). The very high insulation level (0.2 W/m2K) was selected as the optimal insulation level in both scenarios.
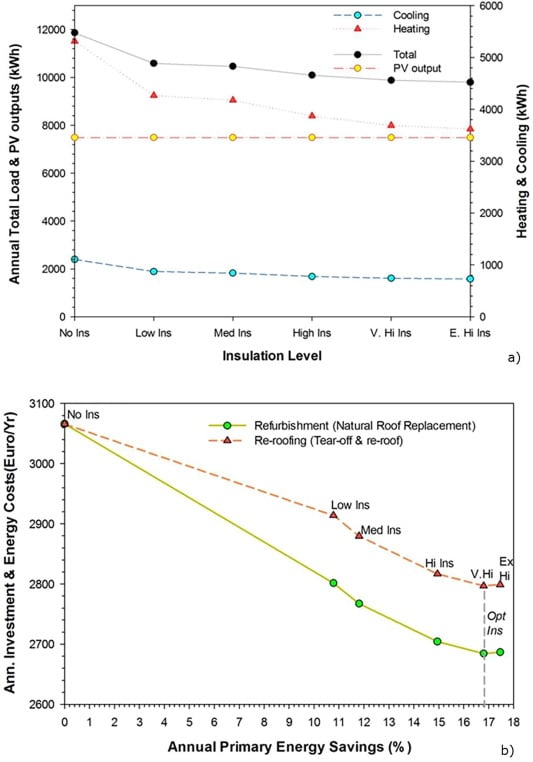
Fig. 6. a) Simulated annual heating, cooling, and total site electricity for various insulation levels for the single-family prototype having a 6 kW PV rooftop system; b) annual primary energy savings compared with investment and energy costs for added roof insulation.
The very high insulation level (180 mm of wood fiber insulation, 0.20 W/m2K conductance) was most often found cost-effective in the optimization with and without PV, both in refurbishment and in re-roof scenarios. A similar or lower conductance would be achieved from 200 mm of cellulose fibre, fibreglass insulation, rock wool or 160 mm of EPS foam or XPS foam (based on data in Table 3 and calculated as detailed in Section 4.4). As shown in Table 5 for the uninsulated single-family prototype, the predicted annual energy savings for insulation were up to 17% of total energy consumption with up to 80% reductions when combined with PV electric generation.
Table 5. Insulation performance in single-family prototype with and without PV shading (the asterisk indicates the optimal level).
| Insulation level | Cooling (kWh) | Heating (kWh) | Total (kWh) | Cooling savings (%) | Heating savings (%) | Primary energy savings (%) |
|---|---|---|---|---|---|---|
| Single-family prototype without accounting for PV shading | ||||||
| No Insulation | 1105 | 5314 | 11,867 | 0.0 | 0.0 | 0.0 |
| Low Insulation | 870 | 4270 | 10,589 | 21.2 | 19.6 | 10.8 |
| Med Insulation | 841 | 4176 | 10,466 | 23.9 | 21.4 | 11.8 |
| High Insulation | 777 | 3872 | 10,097 | 29.7 | 27.1 | 14.9 |
| Very High insulation* | 742 | 3690 | 9880 | 32.9 | 30.6 | 16.7 |
| Extra high insulation | 727 | 3623 | 9798 | 34.2 | 31.8 | 17.4 |
| Single-family prototype accounting for PV shading | ||||||
| No Insulation | 932 | 5179 | 11,559 | 15.7 | 2.5 | 2.6 |
| Low Insulation | 794 | 4241 | 10,484 | 28.1 | 20.2 | 11.7 |
| Med Insulation | 777 | 4156 | 10,381 | 29.7 | 21.8 | 12.5 |
| High Insulation | 742 | 3866 | 10,056 | 32.9 | 27.2 | 15.3 |
| Very High insulation* | 715 | 3690 | 9853 | 35.3 | 30.6 | 17.0 |
| Extra high insulation | 712 | 3620 | 9780 | 35.5 | 31.9 | 17. |
Fig. 7 shows the optimization of insulation compared with adding PV. The plot shows the optimization process, where the most cost-effective option is selected and installed in the building before re-computing all options (as described in Section 4.3). The x-axis shows the annual primary energy savings of the options compared to annualized investment and energy costs. The two fundamental analysed scenarios are shown: refurbishment and re-roofing. Although the order of the optimization selection differs due to the higher cost for re-roofing, the very high insulation level (0.2 W/m2K) was indicated as optimal for both scenarios for the single-family prototype.
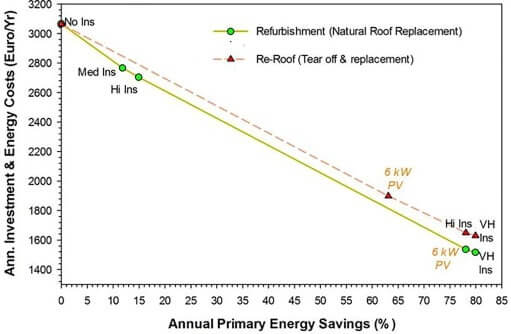
Fig. 7. The optimization process with insulation and PV (6 kW system) in the single-family prototype.
The starting point of the building insulation – either uninsulated or with low insulation – did not change the decision whether to retrofit and to what level. Also, the indicated optimal insulation level did not vary whether refurbishing or re-roofing. When a PV system with electrical storage was considered, the higher cost of the electrical storage system justified the extra high level (0.15 W/m2K, corresponding to 240 mm wood fibre insulation), close to Passive House levels [89]. Table 5 provides performance data at each insulation level with and without PV shading. The Table refer both to the refurbishment and the re-roof scenarios.
The shading from rooftop PV was found to reduce single-family cooling loads by about 4% (715 vs 742 kWh) for the optimally insulated roof. The impact to heating needs was negligible. On the other hand, for an uninsulated single-family roof, the cooling reduction was over 15% (Table 5). However, it must be pointed out that heating need in Northern Italy is on average more than four times higher than cooling, such that roof insulation remained highly desirable. Results could easily differ in cooling-dominated climates such as Sicily.
5.2. Multi-family prototype
Starting with uninsulated roofs, both in refurbishment and re-roof scenarios, the optimal insulation level for the multi-family prototype was the very high level (RSI 4.74, 0.20 W/m2K, corresponding to 180 mm of wood fibre insulation). The savings reductions from the optimal insulation level were 14.6% of total primary energy (Table 6) for the uninsulated case. The total primary annual energy savings were 64.3% with optimal insulation and PV added. The insulation reductions to heating and cooling energy were 36.8% (9071 kWh) and 26.7% (1949 kWh), respectively, in the refurbishment scenario, when the building was uninsulated at the beginning (Table 6).
Table 6. Insulation performance in multi-family prototype with and without PV shading (the asterisk indicates the optimal level).
| Insulation level | Cooling (kWh) | Heating (kWh) | Total (kWh) | Cooling savings (%) | Heating savings (%) | Primary energy savings (%) |
|---|---|---|---|---|---|---|
| Multi-family prototype without accounting for PV shading/thermal interactions | ||||||
| No Insulation | 7301 | 10,947 | 75,451 | 0.0 | 0.0 | 0.0 |
| Low Insulation | 6067 | 8221 | 68,441 | 16.9 | 24.9 | 9.3 |
| Med Insulation | 5911 | 8268 | 67,817 | 19.0 | 24.5 | 10.1 |
| High Insulation | 5554 | 7491 | 65,715 | 23.9 | 31.6 | 12.9 |
| Very High Insulation* | 5352 | 6920 | 64,434 | 26.7 | 36.8 | 14.6 |
| Extra high insulation | 5281 | 6647 | 63,939 | 27.7 | 39.3 | 15.3 |
| Multi-family prototype without accounting for PV shading/ thermal interactions | ||||||
| No Insulation | 6474 | 10,144 | 74,311 | 11.3 | 7.3 | 1.5 |
| Low Insulation | 5709 | 7998 | 68,107 | 21.8 | 26.9 | 9.7 |
| Med Insulation | 5613 | 8107 | 67,564 | 23.1 | 25.9 | 10.5 |
| High Insulation | 5378 | 7433 | 65,607 | 26.3 | 32.1 | 13.0 |
| Very High insulation* | 5243 | 6899 | 64,379 | 28.2 | 37.0 | 14.7 |
| Extra high insulation | 5199 | 6635 | 63,904 | 28.8 | 39.4 | 15.3 |
Fig. 8a shows the predicted annual heating, cooling and total site electricity for the multi-family prototype at various insulation levels. The plot also shows the annual predicted kWh output of the 30 kW PV rooftop system. Fig. 8b indicates the annual primary energy savings compared with investment and energy costs for added roof insulation for the multi-family prototype.
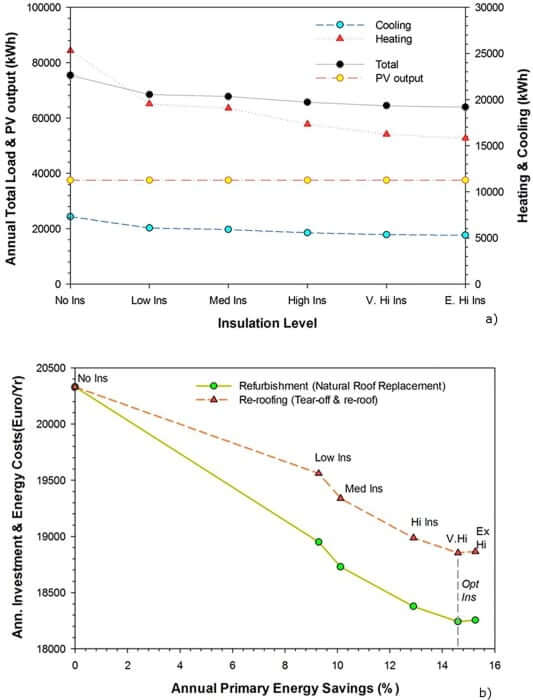
Fig. 8. a) Simulated annual heating, cooling, and total site electricity for various insulation levels for the multi-family prototype having a 30 kW PV rooftop system; b) annual primary energy savings compared with investment and energy costs for added roof insulation.
As seen in Fig. 8, we found that the cost/thermal performance curve was quite flat near the economic optimum. In the re-roofing scenario, when optimizing against PV with storage system, the very high insulation was still selected as the optimal level.
Starting with a low insulation level (0.8 W/m2K), the resulting optimal level was the very high case (0.2 W/m2K), both for the optimized insulation and the PV system with electrical storage.
Tables 6 provide performance data at each insulation level in the refurbishment and the re-roof scenarios, considering or not the shading effect of PV.
Savings from insulation and PV from primary energy were 63.1% when combined with electrical storage. In relation to the impact of shading, cooling was reduced by 11.3% (Table 6, 827 kWh/year savings) in uninsulated multi-family roofs. As expected, the impact of shading and reduced long-wave surface emissivity went down sharply as insulation was added.
Although not yet cost-effective, Fig. 9 illustrates the importance of energy storage from PV in residential building. Fig. 9a shows the hourly output of a 30 kW PV system on top of an uninsulated multi-family building compared to its loads over an entire year. Fig. 9b and 9c show the same data organized by hour of the day for winter and summer. Improved building thermal performance increases the value of energy storage. Fig. 9a shows the importance of how added roof thermal efficiency can reduce daily energy demand in winter providing improved match with daily PV output when daily storage is included.
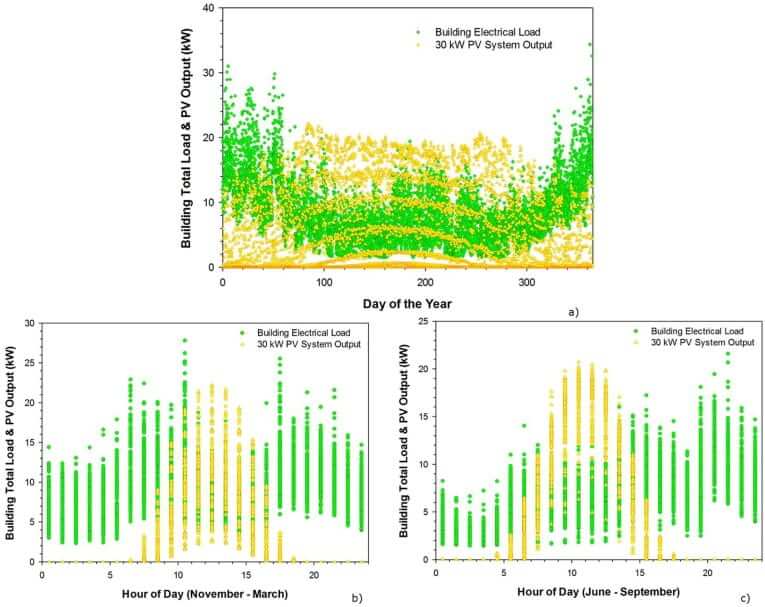
Fig. 9. Building loads and PV output in residential building in multi-family prototype: a) hourly data over a year; b) summer period; c) winter period.
Fig. 9c illustrates the prevailing circumstances in winter, when the solar electric production is limited compared with building loads which are higher in evening hours. Even in summer (Fig. 9b), it is noteworthy that the maximum building loads come after the PV output has dropped to nearly zero. Therefore, 24-hour storage is desirable to exploit the renewable production at the needed time for daily peaks (around 7 am and 6 pm).
Regardless of the load matching advantages, contrary to grid-connected PV systems, energy storage systems are not yet cost-effective without subsidy. This is because of the much higher incremental cost for such systems. This is evident in the higher annualized costs in the PV with energy storage compared with the baseline case (pre-intervention) [91]. However, with time-of-use-rates, which vary over the course of the 24-hour cycle, cost-effectiveness would be increased.
The higher cost of a PV system with electrical storage justifies higher insulation levels to compensate for the higher cost of producing renewable energy on a 24-hour basis. In the multi-family prototype, PV with energy storage systems had a slightly lower annualized investment and energy cost than the baseline condition, but not when the building already had low insulation and was to be re-roofed in order to add further insulation.
5.3. Apartment complex prototype
For this prototype, the optimal insulation level, in all cases where the roof started uninsulated, was the high level (RSI 2.63, corresponding to 100 mm of wood fibre insulation, 0.35 W/m2K). Starting with low insulation (0.8 W/m2K), it was still cost-effective to insulate further to the high level in the refurbishment and re-roof scenario. The optimal roof insulation levels tended to be slightly lower in the apartment complex compared to the single-family prototype (0.35 W/m2K vs 0.2 W/m2K). This is likely due to the lower influence of the roof area relative to the overall building volume and net envelope area and their impacts on heating and cooling needs. However, when considering both PV and energy storage, the higher cost justified the very high insulation level for the apartment complex (RSI 4.74, 0.20 W/m2K, corresponding to 180 mm of wood fibre insulation).
Fig. 10a shows the predicted annual heating, cooling, and total site electricity for the apartment building prototype at various insulation levels. The annual predicted output of the 138 kW PV rooftop system is also shown. Fig. 10b reports the annual primary energy savings compared with investment and energy costs for added roof insulation for the apartment building prototype.
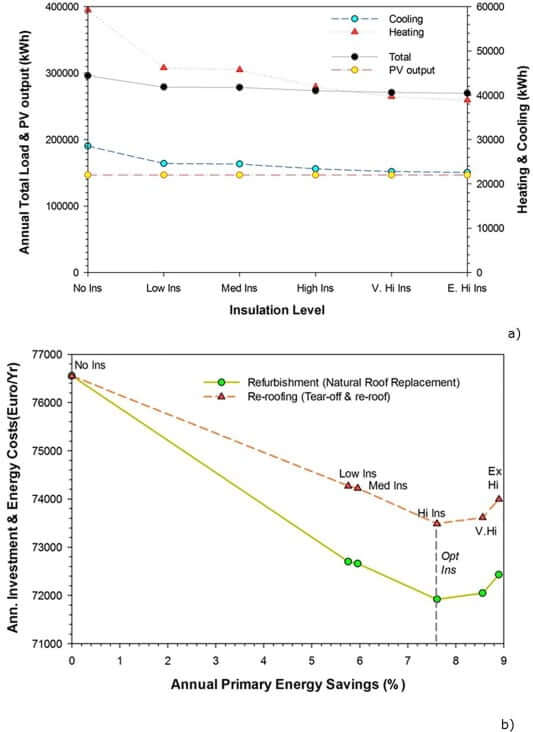
Fig. 10. a) Simulated annual heating, cooling, and total site electricity for various insulation levels for the apartment complex prototype having a 138 kW PV rooftop system; b) Annual primary energy savings compared with investment and energy costs for added roof insulation.
Table 7 shows the performance data at each insulation level in both scenarios. The effect of shading from PV arrays is included.
Table 7. Insulation performance in apartment complex prototype with and without PV shading/ thermal interactions (the asterisk indicates the optimal level).
| Insulation level | Cooling (kWh) | Heating (kWh) | Total (kWh) | Cooling savings (%) | Heating savings (%) | Primary energy savings (%) |
|---|---|---|---|---|---|---|
| Multi-family prototype without accounting for PV shading | ||||||
| No Insulation | 28,570 | 59,244 | 295,991 | 0.0 | 0.0 | 0.0 |
| Low Insulation | 24,581 | 46,178 | 278,936 | 14.0% | 22.1% | 5.8% |
| Med Insulation | 24,449 | 45,727 | 278,353 | 14.4% | 22.8% | 6.0% |
| High Insulation* | 23,379 | 41,914 | 273,470 | 18.2% | 29.3% | 7.6% |
| Very High Insulation | 22,776 | 39,683 | 270,636 | 20.3% | 33.0% | 8.6% |
| Extra high insulation | 22,562 | 38,904 | 269,642 | 21.0% | 34.3% | 8.9% |
| Multi-family prototype accounting for PV shading | ||||||
| No Insulation | 23,731 | 59,294 | 291,202 | 16.9% | −0.1% | 1.6% |
| Low Insulation | 22,649 | 46,735 | 277,562 | 20.7% | 21.1% | 6.2% |
| Med Insulation | 22,611 | 46,275 | 277,063 | 20.9% | 21.9% | 6.4% |
| High Insulation* | 22,304 | 42,336 | 272,817 | 21.9% | 28.5% | 7.8% |
| Very High Insulation | 22,131 | 39,985 | 270,293 | 22.5% | 32.5% | 8.7% |
| Extra high insulation | 22,072 | 39,153 | 269,402 | 22.7% | 33.9% | 9.0% |
As seen in Table 7, the savings derived from the high insulation level were 7.6% of total primary energy (all end uses) for the uninsulated case and 3.0% for the low insulation case. The total primary energy savings were 57.4% with optimal insulation and PV added when the building had no insulation at the beginning. The reduction was 54.8% when the building began with a low insulation level. The specific insulation reductions to heating and cooling energy were 29.3% and 18.2% (Table 7), respectively in the refurbishment scenario when the building started uninsulated.
Fig. 11 shows heating and cooling loads with a varying insulation level, with and without PV shading in the apartment complex prototype.
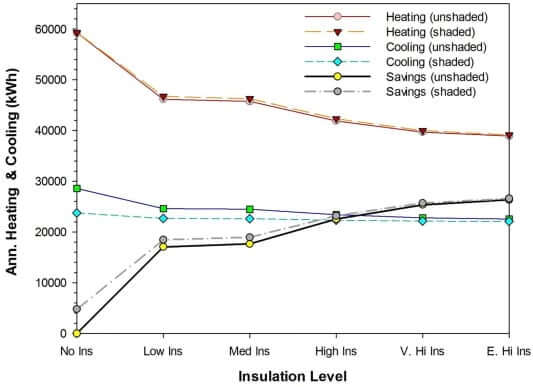
Fig. 11. Simulated heating and cooling by insulation level with and without roof PV array shading in the apartment complex prototype.
PV-related shading reduced cooling by 16.9% (4839 kWh savings) when added to the uninsulated apartment complex (Table 7). Little impact on heating was observed (+60 kWh/year). As with the other building types, the impact of shading and reduced long-wave surface emissivity fell sharply as insulation was added. Shading reduced cooling by 7.9% (1932 kWh) when added to a roof with a low insulation, it increased heating by 1.2% (557 kWh).
As seen in Fig. 11, heating and cooling loads dropped when adding even a low insulation level (0.8 W/m2K). The figure also shows how PV array shading makes a large difference in cooling in the apartment complex, particularly with lower levels of insulation.
Beyond shading, our results show that, under baseline assumptions, adding insulation at the same time as installing PV is cost-effective for all building types. Thus, the optimally selected level exceeds the baseline values. Results show that the combination of improved roof insulation and PV generation can achieve a substantial decrease in energy use. The actual reduction depends on the building type and the existing level of insulation, and varies between 54.4% for a poorly insulated apartment complex to 80.1% for a non-insulated single-family house. Reductions in CO2 emissions reflect the reductions in energy use (between 4.0 t/y in the single-family house and 83.1 t/y in the apartment complex). Energy consumption per net unit area and per occupant generally decreases with occupancy density. However, the results indicate that there is still considerable potential for the combination of insulation and PV for each building type relative to energy requirements.
5.4. Sensitivity analysis
We conducted a sensitivity analysis examining key parameters influencing results including insulation materials and their costs, re-roofing, energy-related carbon pricing and economic parameters. Results for the multi-family prototype are shown, but influences were shown to be similar for the other building types.
5.4.1. Insulation materials
We examined different insulation materials reported in Table 2. We compared the wood fibre insulation performance with extruded polystyrene XPS (Table 3). We composed options that mirrored the conductance of the wood fibre panels from XPS foam insulation with identical conductance, but varied thicknesses to achieve that result.
A sensitivity analysis demonstrated that the other specific insulation properties (specific heat and density) did not impact the selected optimal insulation conductance if the relative cost was held constant, although insulation costs themselves were influential. For the multi-family prototype, we found similar results for the baseline and the selected optimization cases. This verifies what was measured experimentally in Turin [92], where the insulation conductance was the controlling factor in thermal performance. This result also indicated that the optimization tended to be fairly robust in the selection, since the XPS foam cases had a 45% higher cost than the wood fibre ones, yet the same overall conductance values were chosen within optimization.2 This showed that variances in cost of insulation level produced similar optimization outcomes within variations of approximately 40% of the surveyed insulation costs.
5.4.2. Carbon pricing
We conducted sensitivity analysis of the impact of a 100 €/t carbon tax to the electricity cost as advocated by [96]. The utility emissions rate in Northern Italy is presently around 500 g/kWh, corresponding to 0.05 €/kWh increase to the assumed electricity price (Fig. 12).
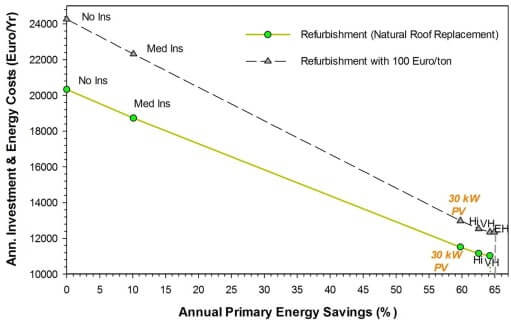
Fig. 12. Multi-family building optimization of insulation and PV system showing sensitivity to 100 €/t carbon tax on results.
The 100 €/t increase in energy cost increased the optimal insulation level by a single increment at the time of installing PV. As example, the very high insulation was selected in the apartment complex building, the extra high insulation level (6.32 RSI, with 240 mm of insulation) in the multi-family and single-family prototypes. This change in the optimal insulation point also produces higher energy savings.
5.4.3. Re-roofing cost
We examined how the initial cost of re-roofing can influence the decision to remove the roof and insulate. In all cases, our evaluation found it cost-effective to remove the roof at expense cost of 45 €/m2 to insulate even to a very high level, if it was already insulated to a low level.
However, in reviewing the cost of re-roofing projects where roofs were removed and then insulated, we found a large range in costs – up to 126 €/m2. Accordingly, we conducted a sensitivity analysis of the cost to re-roof to see how this affected the decision to re-roof. This was done for the multi-family prototype, both for a roof with a low insulation level (0.8 W/m2K) and one uninsulated. We compared the optimization results for the annualized energy and investment costs for each insulation level against the starting level and the base level costs (45 €/m2) (Fig. 13).
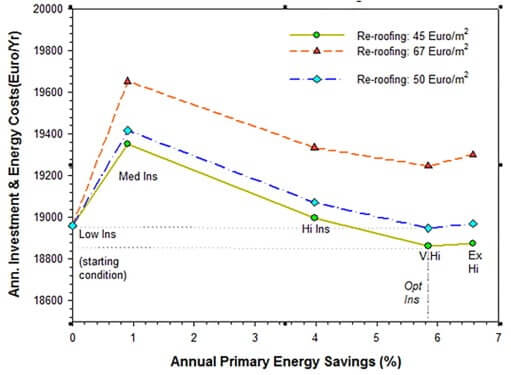
Fig. 13. Sensitivity of insulation optimization to the cost of re-roofing: existing roof with low insulation.
At any cost above 50 €/m2 it is no longer cost effective to remove the roof in order to add more insulation if it already has a low level of insulation (Fig. 13). At 67 €/m2, it is clearly no longer cost-effective. However, if the roof has no insulation at all, the cost for re-roofing can be higher due to the greater annual energy savings. This is shown in Fig. 14 for the same building, but beginning with no insulation. Here we see that it is cost effective to re-roof the building in order to insulate the roof until the costs of re-roofing rise above approximately 130 €/m2. As in all the other evaluations for the multifamily prototype, the optimal insulation level is the very high level (0.2 W/m2K). However, the relatively flat optimization curves in Fig. 14 illustrates how varied insulation materials costs can influence results around the optimum.
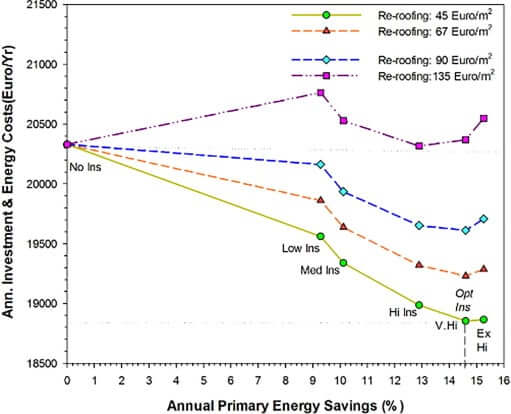
Fig. 14. Sensitivity of insulation optimization to the cost of re-roofing: existing roof with no insulation.
These results illustrate that if the building is to be re-roofed in order to add insulation, the cost-effective limit for re-roofing costs is very different depending on whether the building starts with insulation. The limit is ∼50 €/m2 if the roof already has low insulation, while it is ∼130 €/m2 if the roof has no insulation at all. Finally, although not shown, we note that while economic time horizon and discount rate were examined, they were found to not fundamentally alter the results within a reasonable range of values. From the graphs, variances in the cost of the costs of the insulation materials themselves are seen to be potentially more influential to the selected optimal insulation level than re-roofing cost since the optimization curve is very flat around the indicated optimum.
5.4.4. Rooftop PV shading as aid to lack of cooling or summertime power interruption
Our recommendations for combined roof insulation refurbishment with added PV also has large potential impacts on health and safety in existing apartment buildings during summer heat waves. Many flats in older apartment buildings with low levels of insulation in Europe lack cooling systems. With increased summertime heat waves expected from climate-related warming, the top floor apartments adjacent to the roof deck can experience much higher levels of heat accumulation during summer heat waves that can endanger the health of occupants [95]. Even in flats with cooling systems, there is the possibility of equipment failure. Also with such increased heatwaves, there are increased chances that utilities may experience “brownouts” where power for cooling and or heating systems are temporarily unavailable unless there is electrical storage. Such events will likely happen with increased frequency with greater levels of global warming [96].
Within our evaluation, we examined the air temperatures within the top floor apartment flats with the cooling system disabled, but with natural ventilation on the hottest summer day. We examined predicted performance both with and without a shading cover from an expansive rooftop PV system (Fig. 15).
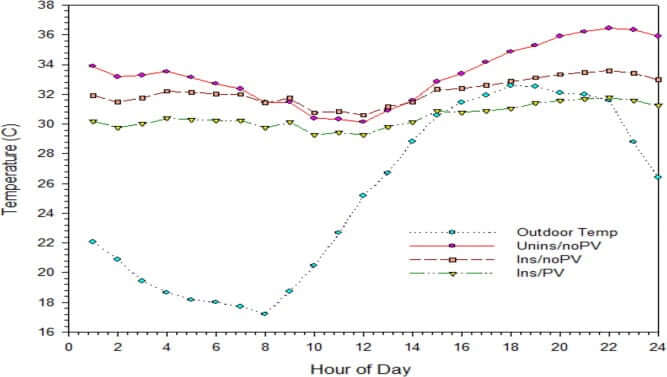
Fig. 15. Comparison of simulated top floor apartment air temperatures adjacent to roof on summer peak day with and without roof shading from PV arrays and insulation (Unins/Ins). Blue dotted line and symbols are the outdoor temperatures on June 26th on the Milan weather file. (For interpretation of the references to colour in this figure legend, the reader is referred to the web version of this article.)
We found that the shading of the PV system to the roof below was highly effective in controlling excess heat accumulation in the top floor dwellings, particularly when matched with insulation (Fig. 15). On the hottest day within the Milan weather file, the elevated indoor temperatures in simulated inside flat 47 next to the roof were much more moderate with the PV system overhead.
During the late evening hours on this very hot day, the inside air temperature in the uncooled and uninsulated flat was predicted at 36.4 °C against 33.4 °C with insulation added.
However, providing PV shading over the top of the roof in the apartment complex with insulation as well was predicted to drop the inside flat temperature without cooling to 31.7 °C, essentially the same as the outdoor temperature. While not comfortable, is indicates a very significant improvement in interior comfort and one to less dangerous levels for occupants. Thus, we show that providing PV shading of roof assemblies with insulation can potentially reduce heat related mortality in European flats, similar to those recently explored for cool roofs [96].
6. Conclusions
Building renovation for efficiency is a global priority to reduce greenhouse gas emissions [97], [98]. We conducted a comprehensive evaluation of the potential energy savings from combining roof insulation with PV electricity generation. We analysed how these two measures can be tuned to optimize the energy performances of different residential building prototypes. For the first time, the overhead shading of solar and long-wave roof irradiance associated with stand-off PV arrays was approximated as part of the evaluation.
Our analysis for Milan, Italy provides a rational framework supporting decisions on roof retrofit and PV installation at the time of natural roof intervention (refurbishment at the time of roof repair) or roof energy-related improvement (re-roofing). We estimated the optimal thickness of applied insulation, the size of the PV systems that can fit on typical buildings and how these two variables relate to annual energy consumption. Although we considered an example in Northern Italy for a continental climate, the methodology can be generally applied to other locations, changing the weather file in the building simulation tool. Sensitivity analysis has examined uncertainties relative to cost of insulation materials and re-roofing.
Our simulations show that adding insulation to uninsulated buildings results in a large reduction of heating and cooling loads. For instance, a medium insulation level on the multi-family prototype (starting uninsulated) can cut heating by 25% (of 6246 kWh, from 25,314 kWh to 19,608 kWh) and cooling by 19% (of 1390 kWh, from 25,314 kWh to 19,608 kWh). Meanwhile, PV generation can provide up to 45% or more of annual energy needs for the example all-electric buildings after insulation levels are optimized.
The following conclusions are summarized from our results:
- • If no insulation is present in the baseline building, it is cost-effective to insulate the roof either in refurbishment or re-roofing scenarios up to a very high level (0.2 W/m2K) in single-family and multi-family prototypes.
- • If a low insulation level is already present in the roof, installing PV with electrical storage is not currently cost-effective without subsidy for such battery systems.
- • In the refurbishment scenario, insulating the roof is more cost-effective since the incremental cost of re-roofing is eliminated.
- • The optimal thermal conductance is between 0.35 and 0.15 W/m2K (from 100 to 240 mm of wood fiber insulation) depending on building type and retrofit intervention. The lowest conductance (0.15 W/m2K) is appropriate for the single and multi-family prototypes with PV generation and electrical storage. The high insulation level (0.35 W/m2K) is optimal for the apartment complex prototype, although this changes to a very high level (0.2 W/m2K) if the insulation is competing with more expensive PV and electrical storage.
- • The optimal roof insulation level is higher in buildings with a higher ratio of envelope area to volume (single-family type, 0.2 W/m2K, and lower in the apartment complex type, 0.35 W/m2K) in all scenarios.
- • The shading from stand-off PV arrays can positively impact uninsulated roofs during summer. The energy required for cooling can be reduced by up to 17% in uninsulated apartment buildings. Impacts on cooling are much lower for well-insulated roofs. Impacts on heating are negligible for all building prototypes except for cases with no pre-existing insulation. These results are in agreement with other studies [57], [58] examining such PV array-roof thermal interactions.
- • When roof insulation is optimized for PV systems with electrical storage, higher insulation levels are justified. For instance, in the single and multi-family prototypes, the optimal insulation level increases from very high to extra high, and from high to very high in the apartment complex prototype. Lower insulation costs or associated subsides, associated with providing on-site electrical storage would also easily justify these levels.
- • Introducing a carbon tax (equivalent to 100 €/t, +0.05 €/kWh electricity price) would increase optimal insulation by one level for all assessed cases (e.g. from high to very high or from very high to extra high).
- • Adding PV arrays to cover and shade multifamily building rooftops can produce much improved interior comfort in top floor dwellings which may not have cooling systems or whose cooling systems may not be functional. In particular, this provides important protection for health and safety of top-floor apartment dwellers.
Results show that installing PV systems with electrical storage and insulating roofs in the refurbishment scenario provides a cost-effective way to improve the thermal performance, while covering a large portion (55–80%) of annual energy and electrical needs. The specific annual reduction in primary energy use from the combination of roof insulation and PV installation was 78% and 80% in the single-family prototype starting with a low insulation and no insulation, respectively. Similarly, annual reductions were 72% and 79% in the multi-family prototype starting with low insulation and no insulation. The energy reduction was lower in the apartment complex (55% starting uninsulated and 57% starting with a low insulation) where the rooftop is a smaller part of the overall building heat transfer envelope.
The authors recognise that energy savings deriving from roof insulation and those from PV generation are not equivalent due to timing. Insulation ensures uniform savings throughout the day, while savings deriving from PV depend on solar radiation and day-hour. If, as projections suggest, PV systems become more common in future building stock, short-term energy storage will become increasingly desirable to maintain grid stability and improve generation load profile.
We conclude that renovation of roof insulation at the time of installation of PV with electrical storage can provide significant reductions to energy use while increasing renewable energy self-consumption. There are other potential significant improvements for protecting the health and safety of occupants during summer heat waves.
Declaration of Competing Interest
The authors declare that they have no known competing financial interests or personal relationships that could have appeared to influence the work reported in this paper.
Acknowledgments
The views expressed are purely those of the authors and do not represent any official position of the European Commission or the University of Central Florida. The authors wish to thank Christian Thiel and Maurizio Bavetta (JRC) for supporting the research. They are also grateful to Heinz Ossenbrink and Robert Kenny (JRC) for their assistance in data selection related to PV, manuscript review, and Nigel Taylor and Arnulf Jaeger-Waldau for providing references. Thanks also to James Fenton (Florida Solar Energy Center) for supporting the collaboration between the JRC and the University of Central Florida.
Data availability
D’Agostino D, Parker D, Melià P, Dotelli G, Data on roof renovation and photovoltaic energy production including storage in existing residential buildings, Data in Brief, submitted.
Author contribution
Work plan: DD, DP, PM, GD; Simulations and result analysis: DD, DP; Writing: DD, DP; Revision of the manuscript: DD, DP, PM, GD.
References
- [1]
-
S. BilgenStructure and environmental impact of global energy consumptionRenew. Sustain. Energy Rev., 38 (2014), pp. 890-902
- [2]
- International Energy Agency, 2017. Tracking clean energy progress 2017 informing energy sector transformations. Retrieved from http://www.iea.org/publications/freepublications/publication/TrackingCleanEnergyProgress2017.pdf.
- [3]
- Brian Dean, John Dulac, Ksenia Petrichenko, Peter Graham, Towards zero-emission efficient and resilient buildings, Global Status Report, available at https://www.worldgbc.org/sites/default/files/GABC_Global_Status_Report_V09_november_FINAL.pdf.
- [4]
-
P.A. Østergaard, N. Duic, Y. Noorollahi, H. Mikulcic, S. KalogirouNeven Duic, Younes Noorollahi, Hrvoje Mikulci, Soteris Kalogirou, Sustainable development using renewable energy technologyRenewable Energy, 146 (2020), pp. 2430-2437, 10.1016/j.renene.2019.08.094
- [5]
- Giorgos S. Georgiou, Paul Christodoulides, Soteris A. Kalogirou, Optimizing the energy storage schedule of a battery in a PV grid connected nZEB using linear programming, Energy 208 (2020) 118177.
- [6]
- Wang Ran, Feng Wei, Wang Lan, Lu Shilei, A comprehensive evaluation of zero energy buildings in cold regions: actual performance and key technologies of cases from China, the US, and the European Union, Energy, doi: 10.1016/j.energy.2020.118992.
- [7]
- Wells Louise, Rismanchi Behzad, Lu Aye, A review of Net Zero Energy Buildings with reflections on the Australian context, Energy and Buildings, Volume 158, 1 January 2018, Pages 616-628, doi: 10.1016/j.enbuild.2017.10.055.
- [8]
-
Yaolin Lin, Shengli Zhong, Wei Yang, Xiaoli Hao, Chun-Qing LiTowards zero-energy buildings in China: a systematic literature reviewJ. Cleaner Prod., 276 (2020), p. 123297, 10.1016/j.jclepro.2020.123297
- [9]
- Mohamed Hany Abokersh, Marleen Spiekman, Olav Vijlbrief, T.A.J. van Goch, Manel Vallès, Dieter Boer, A real-time diagnostic tool for evaluating the thermal performance of nearly zero energy buildings, Applied Energy, Volume 281, 1 January 2021, 116091, doi: 10.1016/j.apenergy.2020.116091.
- [10]
-
Jakob Ahlrichs, Sebastian Rockstuhl, Timm Tränkler, Simon WenningerThe impact of political instruments on building energy retrofits: a risk-integrated thermal Energy Hub approachEnergy Policy, 147 (2020), p. 111851, 10.1016/j.enpol.2020.111851
- [11]
- Usman Alia, Mohammad, Haris Shamsi, MarkBohacek, CathalHoare, KarlPurcell, Eleni Mangina, James O’Donnell, A data-driven approach to optimize urban scale energy retrofit decisions for residential buildings, Applied Energy, Volume 267, 1 June 2020, 114861, doi: 10.1016/j.apenergy.2020.114861.
- [12]
-
D D’Agostino, I Zacà, C Baglivo, P CongedoEconomic and thermal evaluation of different uses of an existing structure in a warm climateEnergies, 10 (5) (2017), Article 658, 10.3390/en10050658
- [13]
-
S. Ferrari, M. BeccaliEnergy-environmental and cost assessment of a set of strategies for retrofitting a public building toward nearly zero-energy building targetSustain Cities Soc., 32 (2017), pp. 226-234, 10.1016/j.scs.2017.03.010
- [14]
- Green Paper, 2014. A 2030 framework for climate and energy policies, COM169, http://ec.europa.eu/energy/consultations/20130702 green paper 2030en.htm European Commission. Taking stock of the Europe 2020 strategy for smart sustainable and inclusive growth, Brussels, 19/3/2014, 2013.
- [15]
- Regulation 2018/1999 of the European Parliament and of the Council of 11 December 2018 on the Governance of the Energy Union and Climate Action, L 328/1.
- [16]
- Renovation Wave initiative Roadmap, 2020, Ref. Ares(2020)2469180 – 11/05/2020, https://ec.europa.eu/info/law/better-regulation/have-your-say/initiatives/12376-Commission-Communication-Renovation-wave-initiative-for-the-building-sector.
- [17]
-
Sarkar Amitava, Bose ShivashishExploring impact of opaque building envelope components on thermal and energy performance of houses in lower western Himalayans for optimal selectionJ. Build. Eng., 7 (2016), pp. 170-182, 10.1016/j.jobe.2016.06.009. ISSN 2352-7102
- [18]
-
Raphael Wu, Georgios Mavromatidis, Kristina Orehounig, Jan CarmelietMulti-objective optimisation of energy systems and building envelope retrofit in a residential communityAppl. Energy, 190 (2017), pp. 634-649, 10.1016/j.apenergy.2016.12.161
- [19]
-
PM Congedo, C Lorusso, MG De Giorgi, R Marti, D D’AgostinoHorizontal air-ground heat exchanger performance and humidity simulation by computational fluid dynamic analysisEnergies, 9 (11) (2016), 10.3390/en9110930
- [20]
-
M. Ferrara, E. Fabrizio, J. Virgone, M. FilippiA simulation based optimization method for cost-optimal analysisEnergy Build. (2014), 10.1016/j.enbuild.2014.08.031
- [21]
- L. Castellazzi, P. Zangheri, D. Paci, 2016, Synthesis Report on the assessment of Member States’ building renovation strategies; EUR 27722 EN; doi 10.2790/052530.
- [22]
- C. Baglivo, P.M. Congedo, D. D’Agostino, Multi-objective analysis for the optimization of a high performance slab-on- Ground floor in a warm climate, 2018, Energies 11(11), doi: 10.3390/en11112988.
- [23]
-
Elizabeth Minne, Katie Wingrove, John C. CrittendenInfluence of climate on the environmental and economic life cycle assessments of window options in the United StatesEnergy Build,, 102 (2015), pp. 293-306, 10.1016/j.enbuild.2015.05.039
- [24]
-
Valentina Fabi, Rune Korsholm Andersen, Stefano CorgnatiVerification of stochastic behavioural models of occupants’ interactions with windows in residential buildingsBuild. Environ., 94 (2015), pp. 371-383
- [25]
- T. Boermans, J. Grözinger, B. von Manteuffel, N. Surmeli-Anac, A. John, K. Klemens Leutgöb, D. Bachner, Assessment of cost optimal calculations in the context of the EPBD. Final report of Project number: BUIDE13705, Ecofys 2015 by order of European Commission. 2015.
- [26]
-
C. Peng, J. YangThe effect of photovoltaic panels on the rooftop temperature in the EnergyPlus simulation environmentInt. J. Photoenergy, 2016 (2016), pp. 1-12, 10.1155/2016/9020567
- [27]
-
C. Piselli, M. Saffari, A. de Gracia, A.L. Pisello, F. Cotana, L. CabezaOptimization of roof solar reflectance under different climate conditions, occupancy, building configuration and energy systemsEnergy Build., 151 (2017), pp. 81-97
- [28]
-
L. Aditya, T.M.I. Mahlia, B. Rismanchi, H.M. Ng, M.H. Hasan, H.S.C. Metselaar, Oki Murazaf, H.B. AditiyaA review on insulation materials for energy conservation in buildingsRenew. Sustain. Energy Rev., 73 (2017), pp. 1352-1365
- [29]
- Zacà Ilaria, D’Agostino Delia, Congedo PaoloMaria, Baglivo Cristina, Assessment of cost-optimality and technical solutions in high performance multi-residential buildings in the Mediterranean area, Energy and Buildings, doi: 10.1016/j.enbuild.2015.04.038.
- [30]
- Zhai Zhiqiang John, Helman Jacob Michael, Implications of climate changes to building energy and design, Sustainable Cities and Society, 44 (2019) 511–519.
- [31]
- Jakub K. Jurasz, Paweł B. Dąbek, Pietro E. Campana, Can a city reach energy self-sufficiency by means of rooftop photovoltaics? Case study from Poland, Journal of Cleaner Production, Volume 245, 2020.
- [32]
- Habibi, Shahryar, Esther Adhiambo Obonyo, Ali M Memari. Design and development of energy efficient re-roofing solutions. Renewable Energy, v. 151, pp. 1209-1219. doi: 10.1016/j.renene.2019.11.128.
- [33]
-
Raphael Wu, Georgios Mavromatidis, Kristina Orehounig, Jan CarmelietMultiobjective optimisation of energy systems and building envelope retrofit in a residential communityAppl. Energy, 190 (15) (March 2017), pp. 634-649, 10.1016/j.apenergy.2016.12.161
- [34]
-
Benjamin Boeckl, Thomas KienbergerSizing of PV storage systems for different household typesJ. Storage Mater., 24 (2019), p. 100763, 10.1016/j.est.2019.100763
- [35]
- NREL, 2017, National Residential Efficiency Measures Database, developed this database on behalf of the U.S. Department of Energy, available online: https://remdb.nrel.gov/ (accessed 10/06/2018).
- [36]
- C. Christensen, S. Horowitz, T. Givler, G. Barker, A. Courney, 2005. BEopt: Software for Identifying Optimal Building Designs on the Path to Zero Net Energy, NREL/CP-550-3733, National Renewable Energy Laboratory, Golden, CO.
- [37]
- C. Christensen, R. Anderson, S. Horowitz, A. Courtney, J. Spencer, BEoptSoftware for Building Energy Optimization, Features and Capabilities, 2006.
- [38]
-
S.A. Klein, et al.TRNSYS 17: A Transient System Simulation ProgramSolar Energy Laboratory, University of Wisconsin, Madison, USA (2010)http://sel.me.wisc.edu/trnsys
- [39]
- Hylke E. Beck, Niklaus E. Zimmermann, Tim R. McVicar, Noemi Vergopolan, Alexis Berg, Eric F. Wood, (30 October 2018). “Present and future Köppen-Geiger climate classification maps at 1-km resolution”. Scientific Data. 5: 180214. Bibcode:2018NatSD…580214B. doi: 10.1038/sdata.2018.214.
- [40]
-
D. Chan, Q. WuSignificant anthropogenic-induced changes of climate classes since 1950Sci. Rep. (2015), 10.1016/j.envdev.2013.03.007
- [41]
- International Energy Agency (2016). Tracking clean energy progress 2016. Retrieved from http://www.iea.org/publications/freepublications/publication/TrackingCleanEnergyProgress2016.pdf.
- [42]
- BPIE. 2013. Building Policies and Programs in the EU-27: EU Overview and Nine Factsheets on ENTRANZE Countries, Buildings Performance Institute Europe.
- [43]
- Fraunhofer Institute for Systems and Innovation Research ISI, 2009. “Study on Energy Savings Potentials in EU Member States, Candidate Countries and EEA Countries: Final Report for the European Commission Directorate-General Energy and Transport”.
- [44]
-
D D’Agostino, L MazzarellaData on energy consumption and Nearly zero energy buildings (NZEBs) in EuropeData in Brief, 21 (2018), pp. 2470-2474, 10.1016/j.dib.2018.11.094
- [45]
-
D’Agostino Delia, Cuniberti Barbara, Bertoldi PaoloData on European non residential buildingsData Brief, 14 (2017), pp. 759-762, 10.1016/j.dib.2017.08.043
- [46]
-
A.M. PapadopoulosState of the art in thermal insulation materials and aims for future developmentsEnergy Build., 37 (1) (2005), pp. 77-86
- [47]
-
D D’Agostino, D Parker, P MeliàEnvironmental and economic data on energy efficiency measures for residential buildingsData in Brief, 28 (2020), Article 104905, 10.1016/j.dib.2019.104905
- [48]
-
I Zacà, D D’Agostino, PM Congedo, C BaglivoData of cost-optimality and technical solutions for high energy performance buildings in warm climateData in Brief, 4 (2015), pp. 222-225, 10.1016/j.dib.2015.05.015
- [49]
- D’Agostino Delia, Cuniberti Barbara, Maschio Isabella, Criteria and structure of a harmonised data collection for NZEBs retrofit in Europe, Energy Procedia 140, 170-18, 10.1016/j.egypro.2017.11.133.
- [50]
- Terna 2018, Monthly report on the electricity systems, available at http://download.terna.it/terna/0000/1073/46.PDF (accessed 26/06/2019).
- [51]
- A. Jäger-Waldau, PV Status Report 2018, EUR 29463, ISBN 978-92-79-97466-3.
- [52]
- A. Jäger-Waldau, Snapshot of Photovoltaics – February 2019, Energies 2019, 12(5), 769; doi: 10.3390/en12050769.
- [53]
- Bot Karol, Ramos Nuno M. M., Almeida Ricardo M. S. F., Pereira Pedro F., Monteiro Cláudio, Energy performance of buildings with on-site energy generation and storage – An integrated assessment using dynamic simulation, 24 (2019) 100769.
- [54]
-
P. Pearce, R. SladeFeed-in tariffs for solar microgeneration: policy evaluation and capacity projections using a realistic agent-based modelEnergy Policy, 116 (2018), pp. 95-111, 10.1016/j.enpol.2018.01.060
- [55]
- Eurostat. 2019. Final energy consumption by sector, available at: http://ec.europa.eu/eurostat/web/energy/data/main-tables.
- [56]
- DECC, 2016. Solar PV cost data https://www.gov.uk/government/statistics/solar-pv-cost-data.
- [57]
- Bellini Emiliano, 2019, Another €4.4 million for solar-plus-storage incentives in northern Italy, available at: https://www.pv-magazine.com/2019/06/24/another-e4-4-million-for-solar-plus-storage-incentives-in-northern-italy/.
- [58]
-
Vasilis C. Kapsalis, Eftychios Vardoulakis, Dimitris KaramanisSimulation of the cooling effect of the roof-added photovoltaic panelsAdv. Build. Energy Res., 8 (1) (2014), pp. 41-54, 10.1080/17512549.2014.890534
- [59]
-
Peng, Yang Tingting, K. Athienitis AndreasA review of research and developments of building-integrated photovoltaic/thermal (BIPV/T) systemsRenew. Sustain. Energy Rev., 66 (2016), pp. 886-912
- [60]
- T. Tsurusaki, A. Tanaka, H. Nakagami, Evaluation of Photovoltaic Power Generation Systems in Residential Homes in Japan: A Partnership Program of Utility and Consumers’ Cooperative, 2000, Proceeding of the ACEEE 2000 Summer Study on Energy Efficiency in Buildings, Vol.1, 355-366, American council for an Energy Efficient Economy, Pacific Grove, CA.
- [61]
-
A. Dominguez, J. Kleissl, J.C. LuvallEffects of solar photovoltaic panels on roof heat transferSol. Energy, 85 (9) (2011), pp. 2244-2255, 10.1016/j.solener.2011.06.010
- [62]
-
V. Kapsalis, D. KaramanisOn the effect of roof added photovoltaics on building’s energy demandEnergy Build., 108 (2015), pp. 195-204, 10.1016/j.enbuild.2015.09.016
- [63]
- W.A. Miller, E. Brown, R.J. Livezey, Building-integrated photovoltaics for low-slope commercial roofs, (2005). doi: 10.1115/1.1877514.
- [64]
-
I. Ballarini, S.P. Corgnati, V. CorradoUse of reference buildings to assess the energy saving potentials of the residential building stock: the experience of TABULA projectEnergy Policy, 68 (2014), pp. 273-284, 10.1016/j.enpol.2014.01.027
- [65]
- European Commission 244/2012. Commission Delegated Regulation No244/2012 of 16 January 2012. Supplementing Directive 2010/31/EU of the European Parliament and of the Council on the energy Performance of Buildings by Establishing by Establishing a Comparative Methodology Framework for Calculating Cost-optimal Levels of Minimum Energy Performance Requirements for Buildings and Building Elements.
- [66]
- Guidelines accompanying Commission Delegated Regulation (EU) No 244/2012 of 16 January 2012 supplementing Directive 2010/31/EU of the European Parliament and of the Council, Off. J. Eur. Union (April (19)) (2012).
- [67]
-
C. Baglivo, Paolo Maria Congedo, Delia D’Agostino, Ilaria ZacàCost-optimal analysis and technical comparison between standard and high efficient mono-residential buildings in a warm climateEnergy, 83 (2015), pp. 560-575
- [68]
- ISTAT, Italian National Institute of Statistics, 2011, Population Housing Census, available at: http://dati-censimentopopolazione.istat.it/Index.aspx?DataSetCode=DICA_EDIFICIRES# (Accessed: June 28, 2019).
- [69]
- SunPower X21-345-D-AC, 2017, Residential AC Module Series, available at: https://us.sunpower.com/sites/default/files/sunpower-x21-345-d-ac-residential-ac-module-series-518982-revb.pdf.
- [70]
- Boermans Thomas, Petersdorff Cartsten, “U-values for better energy performance of buildings,” Prepared for EURIMA, European Insulation Manufacturers’ Association, Ecofys, Cologne, 2007, available at https://www.eurima.org/uploads/F_EURIMA-ECOFYS_VII_report_p1-65.pdf.
- [71]
-
D. D’Agostino, D. ParkerA framework for the cost-optimal design of nearly zero energy buildings (NZEBs) in representative climates across EuropeEnergy, 149 (2018), pp. 814-829
- [72]
-
D. D’Agostino, Da. ParkerData on cost-optimal Nearly Zero Energy Buildings (NZEBs) across EuropeData Brief, 17 (2018), pp. 1168-1174, 10.1016/j.dib.2018.02.038
- [73]
- EN 15251. Indoor environmental input parameters for design and assessment of energy performance of buildings addressing indoor air quality, thermal environment, lighting and acoustics. 2007.
- [74]
- Pei Huang, Marco Lovati, Xingxing Zhang, Chris Bales, A coordinated control to improve performance for a building cluster with energy storage, electric vehicles, and energy sharing considered, Applied Energy, Volume 268, 15 June 2020, 114983. doi: 10.1016/j.apenergy.2020.114983.
- [75]
-
C. Baglivo, Paolo Maria CongedoOptimization of high efficiency slab-on-ground floor by multi-objective analysis for zero energy buildingsJ. Build. Eng., 24 (2019), p. 1007332
- [76]
-
D. Rhodes Joshua, H. Gorman William, R. Upshaw Charles, E. Webber MichaelUsing BEopt (EnergyPlus) with energy audits and surveys to predictactual residential energy usageEnergy Build., 86 (2015), pp. 808-816, 10.1016/j.enbuild.2014.10.076
- [77]
-
S. Horowitz, B. Polly, C. Booten, N. Kruis, C. ChristensenAutomated Comparison of Building Energy Simulation Engines, NREL/CP-5500e52651National Renewable Energy Laboratory, Golden, CO (2012)
- [78]
- R. Henninger, M. Witte, “EnergyPlus 8.3.0-b45b06b780 Testing with Building Thermal Envelope and Fabric Load Tests from ANSI/ASHRAE Standard 140-2011,” Guard Analytics, prepared for U.S. Department of Energy, Washington D.C., May, 2015.
- [79]
- J. Straube, The passive house standard (Passivhaus): a comparison to other cold climate low energy houses. Somerville, Massachusetts: Building Science Corporation; September 2009. BSI-025.
- [80]
- R.H. Henninger, M.J. Witte, D.B. Crawley, Experience testing EnergyPlus with the IEA Hvac bestest E100-E200 series. In: Proc. 8th Int.l IBPSA conference, Eindhoven, Netherlands; 2003.
- [81]
- Italian Meteorological Service, vol. 2. Atlante Climatico d’Italia; 1971–2000.
- [82]
- D’Agostino Delia, Parker Danny, How will climate alter efficiency objectives? Simulated impact of using recent versus historic European weather data for the cost-optimal design of nearly zero energy buildings (NZEBs), Proceeding of Clima 2019, 26-29 May, Bucharest.
- [83]
- European Commission, 2010, EPBD recast, Directive 2010/31/EU Energy Performance of Building Directive.
- [84]
- Baeli Marion, Pelsmaker Sofie, Cost of Retrofitting to Passive House Standards,“ PLEA 2011: 27th Conference on Passive and Low Energy Architecture, Louvain-la-Neuve, Belgium.
- [85]
- Lohse Rüdiger, Staller Heimo and Riel Martina, 2016, The Economic Challenges of Deep Energy Renovation– Differences, Similarities and Possible Solutions in Central Europe: Austria and Germany, ASHRAE Transactions: 2016, OR-16-006, American Society of Heating, Refrigerating and Air Conditioning Engineers, Atlanta, GA.
- [86]
-
D. Chiaroni, V. Chiesa, S. Franzò, F. Frattini, Manfredi V. LatillaThe impact of the electricity tariff reform on renewable energies and energy efficiency investments: the case of the Italian residential marketInt. J. Green Energy, 14 (11) (2017), pp. 889-898, 10.1080/15435075.2017.1336715
- [87]
- ISPRA, 2017. Italian Greenhouse Gas Inventory, National Inventory Report 2017, Report 261/17, Istituto Superiore per la Protezione e la Ricerca Ambientale (ISPRA), Rome. Availble at http://www.isprambiente.gov.it/files2017/pubblicazioni/rapporto/R_261_17.pdf.
- [88]
-
Bianco Lorenza, Pollo Riccardo, Serra ValentinaOld fiber vs synthetic thermal insulation for roofs energy retrofit: a case study in Turin, ItalyEnergy Procedia, 111 (2017), pp. 347-356
- [89]
-
R. Azari, N. AbbasabadiEmbodied energy of buildings: a review of data, methods, challenges, and research trendsEnergy Build., 168 (2018), pp. 225-235
- [90]
-
P. Melià, G. Ruggieri, S. Sabbadini, G. DotelliEnvironmental impacts of natural and conventional building materials: a case study on earth plastersJ. Cleaner Prod., 80 (2014), pp. 179-186
- [91]
- D. D’Agostino, D. Parker, P. Melià, Environmental and economic implications of energy efficiency in new residential buildings: a multi-criteria selection approach, Energy Strategy Reviews 26,100412
- [92]
- World Bank, 2017, Report of the High-level Commission on Carbon Prices, available at https://static1.squarespace.com/static/54ff9c5ce4b0a53decccfb4c/t/59b7f2409f8dce5316811916/1505227332748/CarbonPricing_FullReport.pdf.
- [93]
-
R.S. Kovats, L.E. KristieHeat Waves and Public Health in EuropeEur. J. Pub. Health, 16 (6) (2006), pp. 592-599
- [94]
-
A. Quinn, P. Kinney, J. ShamanPredictors of summertime heat index levels in New York City apartmentsIndoor Air, 27 (4) (2017, Jul), pp. 840-851
- [95]
-
J.A. Añel, M. Fernández-González, X. Labandeira, X. López-Otero, L. de la TorreImpact of cold waves and heat waves on the energy production sectorAtmosphere, 8 (12) (2017), p. 209, 10.3390/atmos8110209
- [96]
-
H.L. Macintyre, C. HeavisidePotential benefits of cool roofs in reducing heat-related mortality during heatwaves in a European CityEnviron. Int., 127 (2019), pp. 430-441
- [97]
-
Delia D’Agostino, Sofia Tzeiranaki, Paolo Zangheri, Paolo BertoldiAssessing Nearly Zero Energy Buildings (NZEBs) development in EuropeEnergy Strategy Rewiews, 36 (2021), Article 100680, 10.1016/j.esr.2021.100680
- [98]
-
D D’Agostino, S Tzeiranaki, P Zangheri, P BertoldiData on nearly zero energy buildings (NZEBs) projects and best practices in EuropeData in Brief (2021)In press